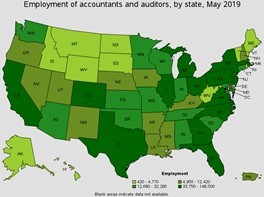
Review the latest stats on CPAs working in the U.S. Find out how many accountants there are, their average salary, and their demographic specifics.
Thomas Jefferson once defined coffee as “the favorite drink of the civilized world.” Tea-lovers might disagree with Jefferson, but coffee industry statistics are clear: Millions of people today can’t imagine starting their day without a cup of the stimulating beverage. Coffee Industry Facts - Key Findings Brazil is the largest coffee producer (33%) and the largest exporter in the world. In 2020, 15 countries imported 76.4% of all coffee. An average American drinks 3.1 cups of coffee daily. By 2030, global coffee consumption is expected to grow by one-third. The US imported $5.7 billion worth of coffee in 2020. In 2020, Starbucks had the largest share of the coffee market - 40%. General Coffee Industry Statistics Wondering where your daily cup of coffee comes from? And whether there will be enough coffee for all coffee-lovers in the future? These statistics will provide the answers. With 33% of all coffee produced, Brazil is the largest coffee bean producer globally. (Statista) Overall, about 50 countries worldwide produce coffee. Brazil takes first place by producing nearly a third of all coffee - about 69 million 60-kilogram bags. It’s followed closely by Vietnam, which produces almost 29 million bags annually. Even though coffee originated in Africa, this continent contributes only 12% to the world’s total production. Small farmers still produce 60% of the world’s coffee. (Carto.com) Considering how popular coffee is, you might expect that growing it is a fully mechanized process that takes place on vast plantations. However, the reality is that only 21% of all coffee is produced on farms more than 50 hectares in size. The majority of producers still pick coffee by hand in an intensive, once-a-year harvest. Global coffee consumption increased 2% between 2019 and 2021. (International Coffee Organization) On the other hand, the production went slightly downward in the same period, which led to minimizing the gap between production and consumption to 1.2 million bags. By 2030, global coffee consumption is expected to grow by one-third. (Bloomberg) The estimates show that by 2030, the world will need an additional 200 million bags to keep up with the growing demand. The main causes of this growth are the expected wage growth and increase in population. In 2020, 15 countries accounted for 76.4% of all coffee imports. (World’s Top Exports) The five countries that import the most coffee are the US, Germany, France, Italy, and Canada. In 2020, these countries imported 47.7% of the worldwide total. Between 2019 and 2020, Germany increased its import volume by 9.4%, while Italy and the US reduced it by 7.5% and 2.8%, respectively. Brazil holds the top spot for coffee beans export. (Statista) Brazil is prominent in our coffee statistics not only as the largest coffee bean producer in the world but also as the number one exporter. In 2020, Brazil exported almost $5 billion worth of coffee. Switzerland was the second-largest exporter, with $2.85 billion. Europe accounts for 33% of the global coffee market. (International Coffee Organization) It seems like Europe has the most coffee drinkers altogether. It’s closely followed by Asia and Oceania, with a market share of 22%, followed by Latin America (20%), and North America (19%). The coffee market in Europe is expected to stay stable throughout 2025 and beyond. The average price of a cup of coffee ranges from $0.46 in Iran to $7.77 in South Korea. (Global Coffee Report) The average price of a cup of coffee varies drastically worldwide. Recent studies have determined South Korea is the most expensive country to drink a cup of coffee in, with the average price being $7.77. On the other hand, the cheapest is Iran, where the average cup of coffee costs $0.46. Only about 10% of coffee is roasted before being exported. (International Coffee Association) Essentially, 90% of all coffee is exported green, which means that roasting actually takes place in the importing country. Since roasting technology differs from country to country, it also affects the overall taste of the coffee. The United States Coffee Market Statistics In this section, we take a look at the US coffee industry size, information on consumer behavior, and imports and exports. In 2020, an average American drank two cups of coffee per day. (National Coffee Association) One of the most interesting coffee drinking facts from the 2020 National Coffee Association report is that the average American coffee-drinker consumes 3.1 cups of coffee per day. Sixty-two percent of Americans drink coffee every day, while seven out of 10 Americans drink coffee at least once a week. The US imported $5.7 billion worth of coffee in 2020. (World’s Top Exports) Americans are among the most avid coffee consumers in the world, with more than 400 million cups of coffee drank per day. 67% of Americans purchased their coffee from the supermarket in 2019. (Statista) Since a considerable percentage of Americans prefer gourmet coffee, one would expect them to shop for their favorite blend at their local coffee roastery or other specialty coffee shop. Still, it appears that customer retention levels in this segment of the industry are not particularly high - only 9% regularly choose this option. The majority of consumers purchase their coffee at the supermarket, 14% order coffee online, on Amazon, or elsewhere, while 13% buy it at their local coffee shop, according to the specialty coffee industry statistics. Almost 60% of all coffee served in the US is brewed from premium beans. (National Coffee Association) While gourmet coffee is rising in popularity, traditional coffee consumption has decreased 10% from 2019 to 2020. In 2020, Starbucks had the most coffee shops in the US. (Statista) With 15,444 stores in the US, Starbucks holds 40% of the US coffee shop market. Dunkin’, the food franchise that made history with 3 million customers daily, holds the second spot with slightly more than 9,000 stores. Tim Hortons, in third place, has 630 stores in the US. When translated into coffee sales, Starbucks generated $21.31 trillion in 2019, while Dunkin’ had $9.2 trillion. 41% of Americans used a drip coffee maker to brew coffee in 2020. (Statista) The second most popular method was the single-cup brewer with 27%, while 12% used an espresso machine to make coffee at home. Only 10% of respondents prefer cold brewing, 8% purchase ready-to-drink coffee in a can or a jar, while 7% purchase instant coffee in a can or a jar. Bean-to-cup brewer is used by 6%, while the remaining methods account for less than 5%. Coffee Consumption Statistics Worldwide - by Demographic Who are the people behind all these coffee-drinking facts and figures? Let’s find out. 72% of people over the age of 60 drink coffee every day. (National Coffee Association) But it’s not just older adults who drink coffee regularly: More than half (54%) of Americans between the ages of 25 and 39 consume coffee, along with 40% of those aged 18-24. The latter group has, in fact, seen a 14% increase in coffee consumption since the beginning of 2021. In the US, women spend on average $400 more on coffee than men. (Perfect Brew) An average American woman spends approximately $2,327 each year on coffee, while an average man spends $1,934. Still, it seems that men simply drink cheaper coffee - if we were to compare coffee consumption per capita by gender, men take the lead with 2.22, compared to women’s 1.79. Hispanic Americans are the most likely demographic group to drink coffee every day. (Perfect Brew) The survey conducted by the National Coffee Association looking to uncover coffee facts and statistics showed that Hispanic Americans are 65% more likely to consume coffee daily than members of any other ethnicity. 41% of millennials spent more money on coffee than on retirement plans in 2017. (Acorns Money Matters) In an Acorns study conducted in 2017, 41% of nearly 2,000 respondents born between the 1980s and early 2000s admitted to spending more on coffee than on retirement. Unsurprisingly, 39% also admitted to feeling anxious about their financial future. Scientists and lab technicians are the heaviest coffee drinkers. (Perfect Brew) Among the top 15 professions that consume the most coffee, scientists and lab technicians take the top spot. Marketing and advertising professionals are second, while education administrators take the third spot. Writers and editors hold the fourth spot, while healthcare administrators take the fifth, according to a recent coffee industry analysis by Perfect Brew. People aged 25-34 spend $2,000 in coffee shops yearly. (Amerisleep) There’s a stark difference between this age group and people over 65, who spend only $7 in coffee shops per year. People aged 18-24 spend $172 per year on average, while the 35-44 age group doesn’t shy away from spending $1,410. These figures could partially be the result of the shift toward remote work, as many remote workers find coffee shops to be more conducive to productivity than their homes.
Anyone who has ever been on a hunt for unique handmade items, vintage treasures, and local artisan products has most likely heard about Etsy. This creative online marketplace started out in 2005 as a project by a group of enthusiasts from Brooklyn, New York. Etsy has soon become an online refuge for artists and artisans from all over the world. The platform has grown into a $33.75 billion business from very humble beginnings. If you're interested in learning more about this eCommerce giant and its journey to the top, check out our Etsy statistics below. Top Etsy Statistics: Editor’s Choice With a market cap of over $17 billion, Etsy is the 12th largest online marketplace globally. Etsy’s annual net income in 2021 reached $493 million. As of 2020, Etsy has 1,209 employees. 97% of Etsy sellers run their shops from home. 62% of sellers on Etsy are from the United States. In 2020, 81% of Etsy sellers identified as women. With a 25% seller share, Home & Living is the most popular category on Etsy. 71% of Etsy sellers consider it important to grow their business sustainably and responsibly. General Etsy Stats To better understand this eCommerce platform and its users, we've compiled a list of some general Etsy statistics. Read below to learn about the number of active buyers and sellers, the revenue Etsy has generated over the years, and the best-seller categories of products available for sale. With a market cap of over $17 billion, Etsy is the 12th largest online marketplace globally. (CompaniesMarketCap) With a market cap of $17.90b as of March 2022, Etsy scores above JD Health, Zalando, and Rakuten, to name a few prominent companies. Etsy traffic statistics have increased majorly during 2020, boosting profits significantly. Nevertheless, the market is still dominated by eCommerce giants such as Amazon, Alibaba, Meituan, Jingdong, and Shopify. There were around 7.5 million active sellers on Etsy in 2021, a nearly 75% increase on 2020. (BussinessOfApps) Back in 2019, there were almost $2.7 million active sellers on Etsy. Only a year later, the figures went up over 60% to around 4.3 million people worldwide, only to balloon by nearly 75% to 7.5 million in 2021. As testified by many Etsy sellers, statistics have never looked so good. The reason behind such a steep surge is most likely the COVID-19 pandemic which forced many people to start selling online exclusively. The number of active Etsy buyers reached 96.3 million in 2021. (BussinessOfApps) Compared to 2019, when some 46.3 million people bought goods on Etsy regularly, 2020 has brought a surge of over 75% for a record 81.8 million active buyers on the platform. This was then followed by a smaller but still impressive 17% increase to 96.3 million users in 2021. Judging by the Etsy buyer statistics, people have heartily embraced the online shopping model forced by the COVID-19 pandemic. As of 2020, Etsy has 1,209 employees. (Backlinko) We can get valuable insights by tracking workflow within a company. Etsy has been growing steadily over the past few years, and the growth was followed by an increase in the number of employees. The 2020 sales boom saw the workforce increase by 14.49%. These Etsy updated statistics do not include an additional 205 workers employed at Reverb, its daughter company. Most of the employees are based in the United States, but the company also has offices in Ireland, Germany, Canada, Australia, and more. Etsy Demographics Let’s take a closer look at the demographic stats and facts, as they provide insights into the target market for a product or service. Additionally, they can help identify new markets or assess the potential impact of changes in the economy or population on a business. By understanding the demographics of its customer base, a company can make better decisions about where to allocate its resources to maximize growth. 62% of Etsy’s sellers are from the United States. (Statista) Etsy seller statistics show the distribution of its sellers on a global level. As of June 2020, some 62% of Etsy's merchants were from the United States, while the remaining 38% come from other countries. The majority of them are from the UK (30%), followed by Canada (11%), Australia (7%), and Germany (7%). Most of Etsy’s US sellers come from California (14%). (Statista) The figures from June 2020 indicate that 14 percent of the US Etsy sellers are located in California. During the measured period, Florida and Texas both contributed 7%, while Pennsylvania, North Carolina, and Washington had a 4% share of the total US seller market each. As of December 2020, 47.7% of Etsy employees were female. (Statista) We highly appreciate Etsy’s gender awareness and diversity politics, especially nowadays when women were only 5% of the CEOs appointed globally in 2020. Namely, the eCommerce giant has been trying to increase the number of women in leadership positions and on its Board of Directors. As of December 2020, 47.7 percent of its employees were female, along with 45.3% male workers and 7% that were classified as ‘other.’ Statistics on Etsy's global corporate demography indicate that the board positions are equally occupied by both males and females, with a 50-50% ratio. In 2020, 81% of Etsy sellers identified as women. (Statista) (Etsy) The figures certainly show how one-sided the sellers’ market is, probably because women dominate the handmade arts & crafts niche. When it comes to Etsy users, statistics on the sellers used to favor women even more in the past. According to a report from 2015, as many as 86% of the sellers on the platform were female. 71% of Etsy sellers consider it important to grow their business sustainably and responsibly. (Etsy) Sustainability and value-driven manufacturing practices are essential to Etsy's community, as reflected in the items being sold on the site. This new approach to business resulted in self-organizing into online support groups. Nearly a quarter of Etsy sellers worldwide joined one of more than 10,000 Etsy Teams worldwide, where they can seek and provide support and collaboration opportunities. 97% of Etsy sellers run their shops from home. (Statista) 2020’s Etsy statistics reveal that 97% of sellers run their shops from home. At the same time, 69% of respondents had started their Etsy shop as a way to supplement their income. For many Etsy sellers, their businesses are their primary source of income, and 69% of them consider their shop a business. More than half (55%) are multi-channel sellers. Revenue and Sales Statistics Although Etsy's sale statistics recently didn't quite match the boom in 2020, the company is still going very strong. The pandemic has brought about a renewed interest in handmade and vintage items, increasing the platform’s popularity significantly in recent years. With a 25% seller share, Home & Living is the most popular category on Etsy. (Statista) Looking at the best-selling items on Etsy and their generated revenue, Statista compiled a list of the most popular categories among handmade Etsy sellers worldwide as of June 2020. According to Etsy sales statistics by category, home and living is on the top of the list with a 25% seller share. This is followed by art and collectibles, which accounted for 21%, jewelry with 15%, and clothing with an 11% share. The least popular group of products were pet supplies, electronics & accessories, and shoes, which accounted for only 1% of sellers each. In 2020, Etsy was the eighth largest retail website in terms of online traffic. (Statista) The big dog among eCommerce websites, Amazon.com, had almost 3.68 billion visitors per month in 2020 followed by eBay.com with 1.01 billion visits on average each month. eBay, Rakuten, and Samsung also scored highly on the list. With a monthly traffic average of 289.33 million visits, Etsy statistics had even top sellers jealous, contributing greatly to the platform’s huge revenue increase during that year. In 2020, Etsy generated $1.7 billion in total revenue. (Statista) The revenue of the online marketplace amounted to $1.7 billion in 2020, which represents a surge of more than 100 percent compared to the year before. Etsy had a market capitalization of $7.46 billion in 2019, just seven years after its official launch. According to industry experts, marketplace revenues (including sales listing and transaction fees), third-party payment processor fees, and seller service revenues are the company's main revenue streams. Etsy’s annual net income in 2021 reached $493 million. (Statista) Looking at the Etsy sales statistics for 2021, there was a massive increase over the $349 million it made in 2020, which itself dwarfed 2019’s $95.89 million. The company is clearly doing something right, and at this rate, the future of eCommerce on the platform is looking very bright. Top sellers on Etsy earn $10,000 per year or more. (The Verge) Amid the many stories from Etsy's sellers regarding their earnings, the conclusion is that the most successful merchants earn $10,000 or more on the platform. Etsy shop statistics vary wildly between the various categories on the site, though. According to some top sellers, they get charged a flat 12% advertising fee that they cannot opt out of. This fee is 15% for other sellers, but that charge is optional.
Call centers are an inescapable element of running almost every customer-centric business. Regardless of whether you are offering a product or a service or using a call center to market them, you need to provide a line of communication with your customers. Not all support and call centers actually require a phone line. Call center statistics show that the industry has moved online to a large degree, and many other trends are emerging as companies strive to provide a better customer experience. Let’s see some of the most important stats about the call center industry in 2022. Call Center Industry Statistics - Key Findings The global market value of call centers is estimated to reach $496 billion by 2027. 87% of employees in call centers report high-stress levels at their job. The contact center software market will be worth $149.58 billion by 2030. Businesses lose approximately $75 billion yearly because of poor customer service. 35% of customers want customer support agents to help them resolve issues in one interaction. General Call Center Operation Statistics Call centers are an essential industry nowadays, especially as many people turn to customer support. After all, the world has made a significant shift toward performing most of its daily life online. So let's check some of the most important stats about this industry. The global market value of call centers is estimated to reach $496 billion by 2027. (Report Linker) Research suggests that the industry's value will keep increasing at a projected CAGR rate of 5.6% between 2020 and 2027. In-house call center solutions have a 5.5% projected growth rate during the same period, while outsourcing will grow by 5.9%. In 2020, US call centers accounted for 29.49% of the global call center market. (Report Linker) The overall global market was valued at $339.4 billion in 2020, with the US share at approximately $100.1 billion in 2020. Other notable markets worldwide were China, Japan, Canada, and Germany, all with strong growth estimates. Almost a quarter of all call centers in the US made less than $250 million in 2020. (Statista) 24%, to be precise. 13% earned more than $25 billion. 4% made between $15 and $25 billion, while 19% earned anywhere from $5 to $15 billion, and another 19% made between $1 and $5 billion. The contact center software market will be worth $149.58 billion by 2030. (Grand View Research, Inc) According to call center statistics for software, the industry's market size is $28.09 billion in 2022, up from $23.9 billion in 2021. If it continues following the estimated CAGR of 23.2% between 2022 and 2030, it should reach a staggering $149.58 billion by 2030. In 2020, US call center businesses employed 2.83 million people. (Statista) The number of employees in the call center businesses grew steadily from 2014 when 2.51 million people worked in this industry. This trend changed in 2020, though, which saw a drop in the number of employees in the contact center industry compared to 2019’s 2.92 million. Businesses lose approximately $75 billion yearly because of poor customer service. (Forbes) Based on research in NewVoiceMedia’s 2018 “Serial Switchers” report, Forbes announced in 2018 that many customers were abandoning companies due to poor customer service. Recent research conducted by Salesforce shows that 91% of customers will make another purchase at the same company after a good customer service experience. In comparison, 70% said they would not buy a product from a company with long wait hours for customer support. If your company is struggling with similar issues, consider investing in call tracking software. Call Center Stats on Customer Satisfaction Customer support is an essential part of providing a quality service, and companies need to pay close attention to customer satisfaction in this area. The following stats tell us more about customer preferences regarding call centers and support. 77% of customers appreciate proactive customer service. (Zippia) On top of wanting instant support, customers also expect customer representatives and sales reps to anticipate their needs and address them accordingly. Companies that can do that are much more popular with customers. 76% of customers prefer using different support channels depending on context. (Salesforce) According to the call center analysis by Salesforce, email is still the most popular customer support channel, followed by phone and in-person support. Online chat and mobile apps take fourth and fifth place, respectively. 78% of customers don’t like support agents that sound like they are reading from a script. (Zippia) Personalized sales and support communication has been the key for a while now. 52% of customers expect custom-tailored offers at all times, and 66% want the companies “to understand their unique needs and expectations.” This is no small feat, especially for the largest call center companies serving thousands of customers. Ensuring your company uses good call center software is only half the battle. You’ll still need quality support agents who can convince your customers that their needs are important to your company. 50% of customers believe that the customer service and support from most companies need a major overhaul. (Salesforce) While half of the customers expect better customer support, 60% agree that companies need to improve their trustworthiness, and 55% think companies should work more on their environmental practices. Statistics show that companies focusing on “making the world a better place” always do well. Surprisingly, improving the product was ranked lower, as was using better technology and working on the overall business model. 35% of customers want customer support agents to help them resolve issues in one interaction. (Microsoft’s 2020 Report) Quick problem resolution should be one of the most important call center metrics. Over a third of customers in a Microsoft survey from 2019 said that resolving issues in one interaction should be a priority for the customer support team. 31% claimed that getting a knowledgeable agent is the most important, and 20% said that not having to repeat the same information is crucial. The latter seems like a growing problem, as more than half of customers felt that the departments providing support are not always in sync. These are definitely the key call center metrics that every company should pay attention to. 92% of consumers hesitate when buying a product if it has no customer reviews. (Fan & Fuel) Worse still, 35% might not buy a product at all after reading just one negative review. According to Zendesk, word of mouth is also extremely powerful: 95% of customers will tell others about a bad experience, and 87% will share good ones. Unfortunately, another survey shows that 79% of consumers who shared their poor online experience with customer support got ignored. Companies making this mistake should consider hiring a good reputation management service, as it will help improve their sales in the long run. Must-Know Information About Call Center Workers Despite the push toward automatization, live agents are still the pillars of any good customer support team. Here are some stats about the call center workforce. There were approximately 286,696 call center agents employed in the US in 2021. (Zippia) The majority of call centers are located in Texas, or more specifically in Dallas and Houston. The average age of a call center employee is 40 years. Furthermore, 67.2% of all agents are women, while 27.9% are men. 87% of employees in call centers report high stress levels at their job. (Cornell University) Handling customer requests every day is not an easy job. Customer support agents are typically the first line of defense against angry customers, leading to very alarming call center stress statistics. 80% of agents experience angry customers blaming them for things out of their control. Undefined expectations, lack of incentives, and boredom with mundane, repetitive tasks cause agents to be miserable at work, which, in return, translates into poorer customer experience stats across the board. The average salary of a call center employee is $27,765 per year. (Zippia) Salaries for new agents start at around $20,000 per annum. Those of the 10% top-performing agents can go up to $36,000 or more. The turnover rate for call center agents is over 40% globally. (ICMI) (Mercer) When these call center turnover statistics are compared to the 22% average turnover rate across all industries in the US, it’s easy to see that job satisfaction levels in call centers are troublingly low. Companies need to look into ways of making the job less stressful for their employees and using modern technologies such as AI bots to help facilitate communication with customers. Call Center Technology Trends Good implementation of modern technologies is essential for improving call center statistics and metrics. Let’s check how big of a role software plays in customer support these days. 90% of businesses that use it find live chat software helpful for streamlining call center operations. (Zippia) According to Zippia’s findings published in December 2021, 29% of all businesses and 61% of those in the B2B sector already use live chat software. 32% of businesses are implementing CRM systems to boost sales and enhance customer relationships. (Zippia) Customer Relationship Management software has an excellent track record of increasing customer engagement. Unfortunately, according to customer service and call center metrics, only a third of businesses make use of it currently. Considering that 31% of customer support teams think that their companies see their work as an expense rather than an opportunity to increase sales, this is not all that surprising. 87% of global organizations that implemented AI did so believing it would give them an advantage over the competition. (Statista) According to Statista, almost 90% of the organizations that implemented AI did so to keep up with the competition, while only 63% did so due to customer demand. Pressure to reduce costs was also a major factor (72%), along with the ability to move into new business spheres (78%). In 2020, 37% of all messages to brand social media accounts were related to customer service issues. (Sprout Social) (Statista) However, most messages (59%) were positive, as customers wished to express their happiness with an excellent experience they’ve had with the brand. Call center statistics show that in 2020, 75% more customers used Instagram to message businesses, while Facebook saw a 20% growth in this category. If you are considering implementing social media into customer support options, keep in mind that 18% of customers expect an immediate response; it might be worth investing in social media management tools to help your support team out.
While some workplaces are more dangerous than others, any workplace can be hazardous. Every year, millions of workers get injured on the job, and many of these injuries are severe. The cost of workplace injuries is huge, not just in terms of medical expenses but also in terms of lost productivity and lost wages. Keep reading our workplace injury statistics to find out how often these accidents occur and what the most common ways workers get hurt are. Top Work Injury Stats - Editor’s Choice: In 2020, there were 3.2 million workplace injuries and illnesses in the US. Sprains, strains, and tears were the most common injuries, with 266,530 cases recorded in 2020. Healthcare and social assistance was the most affected private sector, with 806,200 workers injured or sick. There were 4,764 workplace fatalities in 2020. Most worker deaths happened in transportation incidents, with 1,778 cases recorded in 2020. The total economic cost of workplace accidents and fatalities in 2019 was estimated at $171 billion. The state with the most workplace fatalities in 2020 was Texas, with 469 cases. With 355,200 cases, California was the state with the most occupational injuries and illnesses in 2020. OSHA’s most breached standard is for fall protection in construction. General Work Injury Statistics The latest Survey of Occupational Injuries and Illnesses conducted by the US Bureau of Labor Statistics shows that the number of workplace injuries in 2020 was lower compared to the previous years, but does that mean workplace safety conditions in the US have improved and that the workers have become more safety-aware? Not exactly. The main reason for the drop in preventable workplace injuries and deaths can be found in the decreased number of working hours. The disruption caused by the COVID-19 pandemic reduced the working hours by 9% for the latest survey period. There were approximately 3.2 million recorded cases of nonfatal occupational injuries and illnesses in the US during 2020. (US Bureau of Labor Statistics) Workplace accidents, statistics inform us, resulted in days away from work in 62% of cases. Worldwide, about 340 million work-related accidents happen yearly. (International Labour Organization) A further 160 million workers suffer illness at work. In the private sector, 2.7 per 100 full-time workers suffered nonfatal injuries and illness. (US Bureau of Labor Statistics) Furthermore, 1.7 out of 100 workers had to take days away from work because of accidents or illness. The most common causes of nonfatal injuries and illnesses in the private sector that resulted in days away from work were sprains, strains, and tears, with 266,530 cases recorded in 2020. (US Bureau of Labor Statistics) Workplace back injury statistics show that such accidents are common. They are followed by soreness and pain caused by work activities, fractures, while cuts, lacerations, and punctures are in a close third place. Slips, trips, and falls are the most common workplace injuries, accounting for 33% of all cases. (Thomas Marchese) Water or oil spills, iced walkways and steps, cables, wrinkled rugs, and poor lighting are the main culprits of slips, trips, and falls, statistics tell us. Thankfully, they are also among the most easily preventable causes. Nonfatal injuries and illnesses were most common in healthcare and social assistance, affecting over 800,000 workers in these industries in 2020. (US Bureau of Labor Statistics) Other private sectors with high case numbers were manufacturing and retail trade. Statistics for retail show that 341,100 workers were sick or injured in 2020, along with 373,300 workers in manufacturing. Healthcare and social care are high-stress work environments with the highest injury rate - 5.5 per 100 workers. (US Bureau of Labor Statistics) Workplace safety statistics also list agriculture, forestry, fishing, and hunting as sectors with frequently occurring accidents - 4.6 per 100 workers. They’re followed by transportation and warehousing at 4 per 100. Fires and explosions account for 3% of workplace injuries. (Thomas Marchese) Unfortunately, these types of incidents also have the highest casualty rate across workplace accidents. Workplace Death Statistics Unfortunately, death is still part of workplace injury statistics, despite the improved safety regulations and protocols implemented to avoid preventable fatalities. The reason for hope is that fatal workplace accidents have declined from 2019. In 2020, there were 4,764 fatal work injuries in the US. (US Bureau of Labor Statistics) This is a 10.7% drop from the Bureau’s 2019 report, which recorded 5,333 deaths. Furthermore, this is the lowest annual number since 2013. The fatal work injury rate in 2020 was 3.4 per 100,000 full-time workers. (US Bureau of Labor Statistics) As mentioned, the work injury rates haven’t significantly declined. They merely reflect the fact there were fewer jobs and work hours in 2020 due to COVID-19. According to previous BLS workplace injury statistics, the rate in 2019 was 3.5 full-time workers per 100,000. One worker died in the US every 111 minutes in 2020. (US Bureau of Labor Statistics) This number may seem staggering, but it’s significantly lower than in the period before the Occupational Safety and Health Act of 1970 was implemented. At 1,051, most fatalities were in the 55 to 64 age group. (US Bureau of Labor Statistics) The age group with the second-highest number of fatal workplace injuries are 45 to 54 year-olds. As the smallest portion of the US workforce, underage workers also had the fewest deaths - 26 in 2020. At 1,778, transportation incidents were the leading cause of death for workers in 2020. (US Bureau of Labor Statistics) Most often, these are roadway incidents involving a motorized land vehicle. Workplace fall statistics show that drops from higher elevations are also among the main causes of fatal occupational injuries. 22% of all fatal work injuries were suffered by Hispanic or Latino workers. (US Bureau of Labor Statistics) The Latin-American community in the US has seen increased rates of fatal work injuries. There were 1,088 deaths in 2019 and 1,072 in 2020. Despite the reduced work hours in 2020 and fewer preventable deaths, the rate actually increased by 2% since 2019. Workplace Injury Cost Statistics It’s hard to estimate exactly what kind of an impact workplace injury had on each individual worker. However, the loss of work hours and wages are measurable indicators of the economic impact of occupational injuries. The total economic cost of work-related injuries in 2019 amounted to $171 billion. (National Safety Council) The total includes more than just worker compensation and insurance. The most significant elements of the economic cost are wage and productivity losses ($53.9 billion) and administrative expenses ($59.7 billion). Medical fees and employers’ uninsured costs stood at $35.5 billion and $13.3 billion, respectively. The average cost per worker was $1,100. (National Safety Council) This figure represents the value of goods or services that each worker would have to produce to offset the cost caused by the accident. The expenses for a medically consulted injury were $42,000, while the expenses of a fatal workplace accident stood at $1.22 million in 2019. (National Safety Council) These numbers include estimated wage losses, costs of medical treatments, and employer expenses minus the damage to property or vehicles. Injuries and fatalities in 2019 resulted in 70 million lost workdays. (National Safety Council) However, if you include injuries that happened in the year before that prevented employees from attending work in 2019, the number of workdays lost rises to 105 million. Workplace Injury Statistics by State Texas had the highest number of fatal work injuries in 2020 - 469 recorded cases. (US Bureau of Labor Statistics) This is still a significant drop compared to 2019, when 608 people lost their lives on their job. California comes in at a close second place with 463 cases, and Florida is third with 275 fatalities. The state with the highest number of work injuries and illnesses in 2020 was California, with approximately 355,200 cases. (US Bureau of Labor Statistics) This is almost twice the number of cases recorded in Texas during the same year (178,600). Workplace accident stats place the state of New York in the third position with 129,000 cases. States with the highest rates of nonfatal work injuries and illnesses are Maine, Vermont, Alaska, Washington, Oregon, Montana, and Minnesota. (US Bureau of Labor Statistics) Maine had the highest rate of cases, with 4.3 per 100 full-time workers. The second state on the list is Vermont, with 3.6 per 100. OSHA Injury Statistics The Occupational Safety and Health Administration is a federal agency that regulates workplace safety. It also keeps a record of what safety regulations are most often breached. OSHA employs 1,850 inspectors. (OSHA) These inspectors are in charge of the health and safety of more than 130 million workers across approximately 8 million workplaces in the US. One compliance officer is in charge of approximately 70,000 workers. (OSHA) OSHA has 10 regional offices and 85 offices in local areas. The federal organization conducted approximately 33,000 federal and 42,000 state inspections in 2019. Fall protection for construction workers is the most frequently breached OSHA standard. (OSHA) Apart from fall protection, OSHA workplace injury statistics show that the Hazard Communication standard, Respiratory Protection, general scaffolding requirements, and requirements for the use of ladders in construction are the most commonly breached OSHA standards. Since OSHA’s inception in 1970, worker deaths have dropped from 38 per day to 13 in 2020. (OSHA) OSHA had a significant impact on the safety and health of the US workforce. After it was established, illnesses and the most common workplace injuries have dropped from 10.9 per 100 workers to 2.7 in 2020. Closing Thoughts Safer work practices and adhering to regulations have helped reduce the numbers in workplace injury statistics. In addition to having a good insurance plan for your business, it’s important not to dismiss caution and best practices, no matter in what sector your business operates.
The blogging sphere has been growing ever since the first blog post was published back in 1994. Although in recent years, the onset of primarily visual publishing formats (e.g., YouTube and TikTok videos, Instagram photos and reels, etc.) seems to have dimmed blogging’s light somewhat, it’s still a relevant creative outlet. Writing engaging and authentic content accompanied by visual media seems to be here to stay, even if it’s not as popular as it was before. To highlight the state of the blogosphere, we decided to walk you through some of the most telling blogging statistics of 2022. Stay with us and learn what those blogmasters have been up to lately. Blogging Statistics - Editor’s Choice: There are over 600 million blogs in the world. Bloggers publish over 7.5 million posts daily, or more than 2.5 billion annually. The top three blog niches are food, lifestyle, and travel. Food bloggers have four times as many followers as any other blogging topic. 33% of bloggers don’t earn any money at all. Posts published by those who make $50K+/per year are 2,424 words long on average. 90% of bloggers promote their posts via social media, while influencer collaboration accounts for 10%. 73% of readers admit to skimming blog posts. Blogging at a Glance: General Statistics Before we dive deeper, let’s look at the overview of the industry. How many bloggers are there? Which blogging platforms are the most popular? How frequently do people blog? We’ll answer all of these questions (and more!) below. There were 31.7 million bloggers in the United States in 2020. (Statista) From 2014 to 2020, the number of bloggers in the US increased by 4.3 million, or 15.7%. These blogging trends indicate the industry is far from slowing down and certainly not on the verge of disappearing. There are over 600 million blogs in 2022. (GrowthBadger) That’s almost a third of all the websites on the Internet. That’s a 20% increase in just three years. Now that you know how many blogs there are, let’s see what spiked the figures. The increase in the number of blogs is mainly driven by two factors: First, the continuous growth of internet users worldwide, and second, starting a blog has become more accessible. In the past, you needed to have some technical skills and knowledge to set up a website to blog on. Not so anymore. Bloggers publish over 7.5 million posts daily (i.e., over 2.5 billion annually). (Orbit Media Studios) That’s a lot of content! The average blog post is around 1,200 words long, but the most popular posts are longer, and tend to perform better on social media and search engines. Facts about blogging tell us that many bloggers (27% of them) publish once per week, and 32% of bloggers posting several times a week report strong results. Roughly 70 million new blog posts are published on WordPress every month. (WordPress) According to 2022 research, WordPress is home to a population of bloggers creating around 70 million new blog posts each month, whose readers produce about 77 million new comments. These blog reader statistics indicate that blogs are a great source of customer engagement and interaction with readers and potential buyers of the product you’re advertising. Each month, approximately 409 million people view more than 20 billion pages. (WordPress) WordPress content is one of the biggest contributors to blogging numbers. Blogs on this platform, wherever they may be hosted, attract significant traffic and attracts a large audience, and it’s only growing. And it’s no wonder - WordPress has a wealth of features perfect for SEO and social media sharing. Those new to the blogging ecosystem often go with WordPress or Tumblr. These two platforms enable writing and publishing blogs with the most traffic and exposure. On the other hand, if they’re not interested in blogging professionally, aspiring writers can use platforms such as Blogger. Blog Posts by Topic So, what are bloggers around the world writing about? We will analyze the frequent categories on each platform and identify the type of content that intrigues consumers worldwide. 94% of travel-focused blogs in the US sell advertising. (Optinmonster) Travel blogging statistics reveal that this particular niche is one of the most lucrative in terms of revenue generation. After all, 80% of travel plans are made by consulting the internet, while 33% of US travelers read blogs for assistance. That said, entering the world of travel blogging is no easy task. The competition is high, and you need to stand out from the rest. But don’t let that discourage you – with hard work, dedication, and a bit of luck, you can make a name for yourself in this industry. Over 59% of travel bloggers run more than one travel-themed blog. (Optinmonster) Blogging facts we’ve gathered indicate that, once you find your place in the travel niche, you’ll probably end up starting another blog dealing with the same topic. Namely, nearly two-thirds of travel bloggers run more than one travel-oriented platform. The top three blog niches are food, lifestyle and mom blogs, and travel. (RankIQ) The holy trinity of blogosphere popular and lucrative niches are food (42.8%), lifestyle and mom blogs (13.3%), and travel (10%). The fourth is related to arts and crafts. The top three niches account for the highest percentage of blogs, with over 50,000 monthly sessions, according to the latest facts about blogs. They also represent the top three topics that new bloggers choose to kick-start their blogging journey, with lifestyle accounting for 25%, travel for 18%, and food for 13% of newcomers. There were a steady 4.2 million mommy bloggers in the US between 2012 and 2017. (Verizon) Mumpreneur influencers were blogging early adopters, and their numbers soon grew to a steady population of roughly 4.2 million. These figures are not surprising; in 2010, there were 18.3 million moms who read blogs at least once a month. Considering how much blogs have multiplied since, it only follows that many more of them now cater to this significant demographic. Some of the common topics remained pregnancy and parenthood, as well as family updates. Unfortunately, there aren’t reliable, up-to-date statistics about mom blogging, and we encourage new research to dig into this niche. Food bloggers have four times as many followers as any other industry. (Stella Rising) Different formats are suitable for various topics, and food and blogs seem to go hand in hand. Some bloggers from this niche even have cooking shows and published cookbooks! Most, however, simply regularly post interesting recipes with photos of their mouth-watering creations. With an average of 23,742 monthly unique visitors, food blogs top the list regarding the number of followers in the sphere. Blogging Income Statistics How much a person earns from their blog is one of the best indicators of how their blog is doing. However, this metric will also depend on others. For example, one way of measuring blogging success is how engaged your audience is. A high number of page views and visits is excellent, but if those visitors aren't reading your content or taking any action, then your blog isn't really achieving its purpose. Let’s look at how the top earners in this niche are doing - maybe there are some secrets to be learned! Food is the highest-earning blog niche, with a median monthly income of $9,169 per blogger. (RankIQ) Blogging industry statistics gathered by RankIQ reveal that food bloggers have the highest median monthly income, which amounts to $9,169. The food blogosphere is dominated by a few mega-influencers who have built empires around food blogging. The next on the list of the highest-earning blog niches are the personal finance bloggers ($9,100 in monthly median income), lifestyle and mommy blogs ($5,174), and travel blogs ($5,000). Food bloggers make 42% of their earnings from ads and only 10% from affiliates. (RankIQ) Although you might think the biggest chunk of blog earnings comes from sponsorships or affiliate deals, food bloggers make 42% of their revenues from ads and only 10% from affiliates. The reason behind these blogging statistics and trends is that people interested in food are also interested in buying food-related products. That means that they’re more likely to click on an ad for a cooking product than they are to click on an affiliate link. The other two less lucrative sources of income are online courses and sponsored product reviews. 72% of bloggers making at least $2,000/month use either Mediavine or Adthrive. (RankIQ) Professional bloggers use major ad networks to generate their income. Mediavine is at the top of the list, as this network specializes in working with food and lifestyle bloggers, and it’s used by 40% of all blog creators. Blog marketing statistics reveal that another 32% of them use Adthrive for monetizing their content. The rest use Adsense (approximately 21% of users) and Monumetrics (less than 10%). Around 33% of bloggers don’t earn any money at all. (Medium) If all the aforementioned revenue figures inspired you to start a blog of your own, think again. A third of all bloggers make no money. Just 10% of them earn over $10,000 annually. Only the top-performing 0.6% of US bloggers manage to amass over $1 million per year. These daunting blogging statistics paint a much grimmer picture of the carefree blogger life we tend to imagine. Nevertheless, if you still want to give it a try, start by choosing a niche you can add high-quality content to. The next step is promoting your blog on social media, and perhaps collaborating with other bloggers. 45% of bloggers making over $50,000 a year sell a product or service of their own. (GrowthBadger) Just under half of all bloggers earning more than $50,000 per year sell their own product or service. At the same time, only 8% of lower-income bloggers do the same. These statistics on business blogging indicate that those aiming to live on their blogging income need to develop personalized merchandise or an innovative product to market to their audience. Examples include online courses, digital products, or merchandise lines to sell on eCommerce platforms. Length does matter: Posts published by top-earning bloggers are 2,424 words long on average. (GrowthBadger) It seems that longer articles are associated with greater success. Bloggers who earn more than $50,000 per year report that their most popular blog entries contain 2,424 words on average. That makes their top-earning posts 83% longer than those from lower-income bloggers, as statistics about blogging indicate. Longer articles are more comprehensive and offer more value to the reader. If you want to earn a significant income from your blog, focus on writing in-depth articles with personalized content. Marketing Stats and Facts Let's see how high-earning bloggers promote their content and monetize it. After all, 31% of marketers count on blogging to raise brand awareness. Nowadays, you can easily create a website for free and promote your blog or products via different channels. For example, social media is a great way to reach many people quickly and generate above-average blog traffic. At the same time, email marketing allows you to build a relationship with your subscribers over time. Let’s see the most popular and effective ways to reach your target audience. High-earning bloggers offer free products and services 700% more often than those who earn less. (GrowthBadger) Higher-income bloggers are seven times more likely to provide free items and services than bloggers in lower income brackets. Giving away free eBooks, templates, courses, and free trials of products or services that you sell can significantly increase your revenue, thanks to backlinks and driving traffic to the platforms you promote. High-income bloggers focus on email subscribers twice as much. (GrowthBadger) Blogging about trending topics, as statistics reveal, isn’t enough to gain followers. Bloggers who earn over $50,000 per year from their blogs are over twice as likely to focus on their email subscribers compared to lower-income bloggers. They also use three times as many email-collection methods as lower-income bloggers. Even though we tend to disregard it as obsolete, email marketing remains the best way to build a relationship with your readers and sell them products and services over time. 90% of bloggers promote their posts via social media channels, while influencer collaboration accounts for just 10% of blog promotion strategies. (Statista) Statistics on using social media with blogging from 2021 show that 90% of online bloggers utilized expert social media management to bring visitors to their blog articles. At the same time, some 10% teamed with other influencers to do the same. Paid services were employed by 13% of respondents, while email marketing was used by 62%. Lastly, 68% of blog posts were marketed using SEO techniques. No wonder, as 51% of all website traffic comes from organic searches. 70% of high-earning bloggers actively promote their posts, while only 14% of lower-income ones do the same. (GrowthBadger) The importance of engaging your audience and marketing yourself to them isn’t lost on top-notch bloggers. Namely, blogging stats indicate that over two-thirds (70%) of bloggers who earn over $50,000 annually promote their blogs in an active or very active way. At the same time, only 14% of lower-income bloggers are active promoters of their content. More than half of lower-income bloggers (54%) claim they are minimally active in marketing their content or products; they primarily just share post announcements on their socials. Blog posts that contain images receive 94% more views. (David Hall Social Media) Visual storytelling is one of the most powerful tools in a blogger’s arsenal. Namely, content without pictures will probably be ignored by potential readers. On the other hand, blog readership statistics clearly show that eye-catching visuals receive nearly twice as many views as pure text posts. Statistics on Content and Readers If you're wondering what kind of content attracts an audience, what are popular platforms and channels for posting them, or do people still read blogs in the first place, you’ll find the statistics and relevant data we’ve gathered very useful. You’ll be able to figure out what's working and what's not in the blogosphere and see what influences the level of engagement. 73% of readers admit to skimming blog posts. (HubSpot) In research that dealt with content trends, 62% of respondents claimed they pay detailed attention to video content, followed by news articles, multimedia articles, social media posts, and other interactive posts. On the flip side, 73% of respondents admitted to skimming blog posts. Podcasts are even lower on the engagement list, with just 22% of listeners consuming them thoroughly. Blogging reader statistics show that most readers tend to multitask when reading content. Capturing and keeping their attention might be more challenging than anyone thought. 55% of blog visitors read articles for 15 seconds or less. (Time) Speaking of skimming, the average reader won’t spend more than 15 seconds reading blog content. That is, at least 55% of the respondents won’t. The results improve significantly when you narrow your search to only include article pages. Even so, one in every three visitors spends less than 15 seconds reading articles they come across. This is a pessimistic take on how many people read blogs and how much time they spend on them. Headlines with a question mark get 23.3% more shares on social networks. (Backlinko) When we discuss blog content that can engage the readers, we shouldn’t ignore the headlines, as it seems they can make all the difference. Namely, blog posts with a question mark headline and inquisitive tone will get 23.3% more shares on social networks than those with statement openings. What’s more, headlines that are longer and contain at least 14 to 17 words generate 76.7% more social shares than shorter ones. 59% of people share a blog post without reading it. (OptinMonster) Knowing who reads blogs is less important than knowing who doesn’t, but still passes them on. Namely, 59% of people will share a blog post without reading it first, or ever. This trend indicates that headlines and snippets are becoming increasingly more important in blogging. Also, it's worth remembering that creators have to capture our attention quickly and keep it throughout the post. Writing punchy headlines and staying concise are a blogger’s greatest weapons these days. 75% of the audience prefer reading blog posts under 1,000 words. (SemRush) Although the most profitable blog posts are long, overall blogging statistics tell us that very few readers read through long articles. Three-quarters of readers prefer blog posts of 1,000 words or less. Short, easily consumable text, further broken up into smaller chunks with catchy headings, gets more traffic. What’s more, posts containing videos and images get a higher click-through rate.
Vending machine profit statistics and forecasts show that the coming few years are going to be more lucrative for the industry.
Incorporating enough physical activity into our increasingly sedentary lifestyles is difficult. However, people are more aware nowadays that regular exercise has significant health benefits. That awareness created room for the fitness industry to grow - and these exciting fitness industry statistics will tell us just how much. Read on! Fitness Stats (Editor’s Choice): The COVID-19 pandemic reduced the fitness industry’s market size by 16.24%. The digital fitness market is set to reach $26.55 billion in 2026. 17% of US gyms were permanently closed due to COVID-19. 44% of the fitness industry workforce was left without a job in 2020. In 2019, Americans visited gyms and fitness clubs 6.7 billion times. The average monthly fitness club membership in the US costs $52. Millennials make up 35% of the fitness industry’s customer base. Fitness industry job prospects are predicted to grow 39% in the following ten years. Global Fitness Industry Statistics Before the COVID-19 pandemic, the global fitness and health club market grew to $96.7 billion in 2019. (Statista) Prior to the pandemic, the fitness industry had been experiencing steady growth since 2015. Its most significant leap happened between 2017 and 2018, when the industry grew from $87.2 billion to $94 billion. As expected, some of the top fitness clubs, like LA Fitness, ClubCorp, and Life Time, are in the US. LA Fitness had $2.15 billion in revenue in 2019, quickly taking the top spot as the global industry leader. In 2020, the fitness industry market size dropped to $81 billion, as a result of the COVID-19 pandemic. (Mordor Intelligence) The fitness industry - brick-and-mortar clubs and gyms in particular - has been severely impacted by the pandemic and state-imposed restrictions, especially in the US. The global industry experienced a significant drop (16.2%) in market size. The projected fitness industry CAGR between 2021 and 2026 is 7.21%. (Mordor Intelligence) As countries lift strict restrictions, the fitness world is getting back on its feet. The main driving factors for this industry will most likely be the growth of disposable income now that the job market is recovering, increased health awareness, and the possibilities for safe exercising on location. The global digital fitness market size is expected to reach $26.5 billion in 2026. (360 Research Reports) In 2020, the market for fitness wearables that record your health and assist in training regimens was estimated at almost $9.6 billion. With a predicted CAGR of 18.5%, it’s expected to triple by 2026. Fitness Industry Market in the US: COVID-19 Aftermath The US fitness industry dropped from an all-time-high revenue of $35 billion in 2019 to only $15 billion in 2020. (IHRSA) It’s estimated that the COVID-19 pandemic inflicted around 20 billion dollars’ worth of losses to the US fitness industry’s revenue in 2020. This comes as no surprise, as in some states (e.g., Washington, Oregon, and California), restrictive measures and closures lasted for a year and created a harsh environment to maintain a business. In other states, restrictions were less severe, as they allowed establishments to operate at 50% capacity, move their operations outdoors, or hold online training sessions. Small businesses with excellent insurance fared better, but the industry was still severely hit. Almost 17% of US gyms and fitness clubs were permanently closed because of the pandemic. (IHRSA) According to information from some of the largest payment processors cooperating with the fitness industry, boutique fitness industry statistics paint a grim picture: 19% of boutique studios had to close their businesses permanently in 2020. Another 14% of traditional gyms had to shut down for good. Seven major sport and fitness companies filed for bankruptcy in 2020. (Business Insider) Companies like Cyc Fitness, Yoga Works, Flywheel Sports, Town Sports International, 24 Hour Fitness, Modell’s Sporting Goods, and Gold’s Gym are some of the major business franchises severely weakened by the pandemic. In 2019, 24 Hour Fitness was an industry leader, earning more than 1.4 billion in revenue. Unfortunately, in 2020 it had to file Chapter 11 and close around 144 locations. Likewise, Town Sports International had to shut down over 100 sites. 44% of the fitness industry workforce lost their jobs in 2020. (IHRSA) These fitness industry statistics are unfortunate, and the industry employee count dropped from 3.2 million to 1.8 million. This affected small-business owners as well, and with extended restrictions, some of these job prospects may never recover. The infection rate in US gyms was 0.002%, out of 49.4 million check-ins from 2,877 locations. (IHRSA) According to a study conducted by the University of Florida, thanks to gym patrons abiding by safety guidelines, the number of detected infections was not statistically significant. Fitness industry statistics for 2021 also show that 69% of gym-goers were confident in the safety protocols within their gym. Fitness and Health Industry Trends During the pandemic, gym closures caused an increase of 130% in sales of fitness equipment. (NPD) Some equipment sales experienced impressive triple-digit growth. Businesses had to fulfill increased orders for items such as yoga mats (146%), stationary bikes (170%), free weights (181%), and weight benches (259%). The global fitness equipment market is predicted to grow to $14.7 billion in 2028. (Fortune Business Insights) Fitness industry trends and statistics show that the market for exercise equipment is currently valued at $10.7 billion, and forecasts show that it will grow at a CAGR of 4.6% in the next seven years. The fitness apps market is expected to grow by $1.68 by 2024. (Business Wire) Forecasts for the fitness apps market are bullish, and the estimated CAGR between 2020 and 2024 is 12%. This software niche’s most crucial driving force will be the increased use of wearables that track your physical performance while exercising. In 2019, there were around 6.7 billion visits to US health clubs. (IHRSA) Fitness industry trends and statistics show positive trends for the industry’s future, as Americans are willing to dedicate time to their health and exercise. More than 27.3 million people visited a gym more than 100 times during the year, while 17.8 million went more than 150 times. On average, Americans pay $52 for a gym membership. (IHRSA) Around 25.9 million Americans, which roughly is two out of five gym members, pay less than $25 per month for their membership. However, a significant number of people - 8.2 million, in fact - are willing to pay more than $100 for a gym membership each month. Thanks to that, health and fitness industry statistics show that the average monthly membership is quite high. A home gym costs between $1,400 and $5,000 to equip. (ACMS’s Health & Fitness Journal, IHRSA) It’s not hard to see how the COVID-19 pandemic influenced how people exercise. Working remotely made it easier for people to join online live or pre-recorded training sessions and exercise at home. Therefore, many were interested in amping up their at-home exercising, either through affordable bodyweight programs, or by decking out entire rooms with workout gear. 68% of Americans plan to continue using online fitness services. (IHRSA) Online fitness industry statistics show that the pandemic forced people to adjust to the new norm, and most Americans tried out fitness apps and video-guided exercises. Just under a third of them also participated in a fitness challenge to keep their exercise regular. 94% of Americans plan to return to their gyms. (IHRSA) Americans are keen to increase their physical activity again, and 88% are confident in safety precautions taken in their workout establishments. People with preexisting conditions are at an elevated risk of COVID-19, but 60% of them also said they want to exercise more, albeit in safer conditions. Fitness Demographics Between 2010 and 2019, women’s gym attendance has risen by 32.2% and men’s by 23.2%. (IHRSA) Americans are increasingly getting conscious about their health and physical exercise. Unfortunately, due to the COVID-19 pandemic, 2020 remains an outlier year for fitness clubs and gyms. Luckily, most men (51%) and women (65%) have a goal of increasing their physical activity, so gyms can also expect some of them to return. Men pay $54 on average for their fitness and health club memberships, while women spend $50. (IHRSA) Men are generally more likely to pay a premium price for club memberships. Statistics on the fitness industry show that more than 65% of people that pay more than $200 per month are men. Women are more conscious about their spending as less than 50% pay more than $100 per month. Millennials make up the largest share of fitness and health club members in the US, at 35%. (IHRSA) Gen X and Baby Boomers are the next age groups that are frequent attendants of fitness and health clubs at 22% and 21%, respectively. Gen Z and the Silent Generation make up 16% and 6% of all gymgoers. However, fitness industry growth statistics show that the last two are among the most growing age groups attending health clubs. The 6 to 17 age group had the highest increase in memberships from 2010 to 2019 - 69.81%. (IHRSA) Health clubs have been attracting more younger adults and children. These generations are followed by 55 to 64-year olds at 42.48% and people older than 65 at 34.16%. Hispanic people contributed the most to gym and fitness club membership growth, with a 94.5% increase in signups. (IHRSA) The numbers of Black and Caucasian gym members have also increased by 24.7% and 25.6%, respectively. Fitness equipment industry statistics show that treadmills are the most popular exercise machine across all ethnic groups, followed closely by free weights. The largest demographic with health club memberships in the US are Caucasians at 66.3%. (IHRSA) Hispanic people follow them, with 12.78%, then Black people (12.3%). People of Asian/Pacific Islander ethnicity contribute 7.19%. Fitness Industry Analysis - Job Prospects In 2020, the median wage of a fitness instructor and trainer was $40,510 per year. (US Bureau of Labor Statistics) As reflected by gym industry statistics, this is a job where employers commonly accept people with practical experience rather than formal education. Most people in the industry start on a payroll of a small business. As you continue to work, you can specialize and get appropriate certification for the type of training you are holding. The most common fitness instructor certifications are for strength training, yoga, and kickboxing. The job market for fitness trainers in the US is expected to grow by 39% between 2020 and 2030. (US Bureau of Labor Statistics) Fitness industry growth is projected to create around 69,100 job openings for trainers and instructors yearly on average for the next ten years. A significant portion of those job positions is expected to result from part of the current workforce retiring and moving to other industries. Before the pandemic, in 2019, the fitness industry served more than 184.5 million members. (Statista) The industry almost doubled in the decade preceding 2020, as it grew from 119.5 million members in 2009. The number of fitness and health clubs in the US dropped to just over 32,000. (Statista) Before 2020, there were more than 41,000 fitness establishments in the US. Unfortunately, a significant number had to close down. On the plus side, as the country recuperates from the pandemic, the fitness industry growth rate shows an increasing demand from the public that can’t wait to return to their regular exercise regiments. Fitness Industry in Europe The European fitness and health club industry is a $36.5 billion market. (Statista) The European fitness industry includes everything from sports to gyms and even fitness apps. The sector had 63 million customers across the EU in 2019. The e-health segment of the industry is also on the rise, netting more than $537.8 million in the UK and around $509 million in Germany. Germany and the United Kingdom have the highest fitness revenue in Europe, with $6.3 billion each. (Statista) Fitness industry market research shows that Germany and the UK have significantly larger fitness markets than the other European countries. France has a $2.9 billion market while Italy and Spain sit at around $2.7 billion each. 28% of EU residents exercise more than five hours per week. (Eurostat) Unfortunately, 28% of EU residents don’t exercise at all. Another 17% exercise between three and five hours per week and 27% up to three hours. Over 90% of Romania, Denmark, and the Netherlands’ population participate in physical activity outside of work. On the downside, fitness industry stats show that Portugal and Croatia are on the opposite side of the spectrum, with only 45% and 36% of people taking the time to exercise, respectively.
Not too long ago it would have been difficult to imagine sales reps who didn’t have face-to-face meetings with potential customers. But the world has changed. Everything about the way we travel, work, and spend looks different today. The latest sales statistics highlight some of the market turmoil caused by the pandemic while showing the acceleration of digital transformation as well as promising growth trends and soaring sales figures in individual industries. The following stats will walk you through specific sectors and point out some of the more surprising and interesting sales facts. Salest Statistics Breaktown - Editor’s Choice: AI adoption by sales teams rose by 76% since 2018. An average of 18 calls is needed to connect with buyers. 60% of contacted buyers reject the offer four times before saying yes. 57% of people prefer buying from sales representatives who don’t hassle them. Handgun sales in October 2020 rose by 65% when compared to the same period in 2019. Video game sales amounted to $4.93 billion in July 2021, marking a 5% year-over-year increase. Toilet paper sales and fun facts about spending in the US show that demand for this product rose by 845% in 2020. 60% percent of sales reps increased their number of virtual meetings since 2015. (Salesforce) Even before the pandemic, virtual sales were on the rise, with many sales representatives reporting that they touch base with prospective customers and existing clients via video chat rather than traveling to meetings and lunches. Perhaps unsurprisingly, 62% also said they spend more time on their computers, tablets, and smartphones than they did a few years ago. These sales trends tell us that virtual selling is here to stay. AI adoption rose 76% since 2018, with 37% of sales teams now using it. (Salesforce) As is the case in many industries, the acceleration of the digital transformation process is evident in the sales sector. Artificial intelligence or AI is one of the technologies that’s being rapidly adopted, with 37% of sales teams implementing these advanced tools globally in 2020. That marks a 76% increase since 2018. According to recent sales statistics, 77% of sales leaders and 84% of sales ops professionals claim their digital transformation has become more rapid since 2019. The AI tools also help power CRM software, which is crucial for managing customer relationships. The use of smart sales tools has gone up by 300% since 2017. (Membrain) The substantial increase in both the types and the use of sales technology tools is being fuelled by online purchasing. Sales stats from 2017 reveal that most organizations at the time used only two main tools: CRM software and online meeting tools. Two years later, leads list/database, social selling, account targeting, and skills training and recruiting were added to the list. With six tools in regular use, the sales sector started to see more opportunities for leveraging technology to better cater to customers. 91% of consumers would like to see interactive content in marketing emails. (Hubspot) A Litmus report dubbed 2021 State of Email reveals most respondents feel that only interactive content in marketing emails can get their attention. However, only 17% of marketers actually use such content when advertising their products or services. Depending on your target audience and relevant sales information and analytics, you can add interactivity into your emails by including an embedded video, animated GIFs, a form, faux video, or carousel. Think about creative SMS content, too, or employ mass text software to help you create one with catchy phrases. An average of 18 calls is needed to connect with buyers. (Gartner) Reaching potential buyers isn’t always easy. Consumers are generally suspicious when it comes to calls from sales reps and tend to avoid them by hanging up or not answering the phone at all. Likewise, only 23.9% of sales emails are opened, and others usually end up in a bin. The sales numbers indicate that more investment is needed into technologies that help locate potential buyers and improve the quality and quantity of communication. 60% of all contacted buyers reject the offer four times before saying yes. (Invesp) Follow-up calls can make all the difference. But almost half of the salespeople (48%) never make a single follow-up attempt. Statistics that expose this passive trend among sales reps also indicate that consumers tend to change their minds if called at least four times. An astounding 60 percent of contacted prospects agree to buy a product or service during the fifth call, according to sales follow-up statistics compiled by the US consulting company, Invesp. 57% of people prefer buying from sales representatives that do not hassle them. (Invesp) Even though follow-ups are essential for convincing customers to purchase your product, more than half of the respondents said they prefer buying from sales representatives who aren’t too pushy. Salespeople have a reputation for hassling potential consumers, and these figures show that they would improve their chances of making a sale if they change their approach. 70% of businesses agree that retaining customers is cheaper than acquiring new ones. (Invesp) Prospecting statistics reveal that even though most newly established businesses have to focus on acquiring new customers, the long-run focus should be on retaining them. Namely, it costs five times as much to gain a new buyer than to keep an existing one. Unfortunately, despite the convincing figures in favor of focusing on retention, only 40% of companies and 30% of agencies cultivate the same approach to acquisition and retention. The American auto industry was showing signs of recovery in the summer of 2021, with nearly 1.2 million cars sold in July. (Goodcarbadcar) Following a sharp decline that saw sales plummet from 17 million in 2019 to just a little over 14.5 million in 2020, the car industry started showing signs of recovery by mid 2021. But according to United States car sales statistics, the positive trend failed to extend into the spring, with only 589,743 automobiles sold in October. Those are the lowest monthly sales figures in years. California accounts for the highest number of car sales in the US. (Statista) Research from 2019 shows that the state of California registered more than 14.8 million automobiles that year alone. The state is also the biggest market for electric vehicles, plug-in hybrids, and for used car sales. Statistics by state reveal that Texas had the second-highest number of automobile registrations, with just over 8.3 million cars registered. Texas is followed by Florida (7.8 million) and New York (4.4 million). Handgun sales in the US in 2020 rose by 65% compared to 2019. (Statista) The US gun industry is having a good pandemic, with Americans buying handguns in record numbers. Research shows that in October 2020, around one million handguns were sold, marking a 65% increase compared to the same period in 2019. Gun sales statistics also reveal a spike in handgun sales in June 2020, when 1.511.710 items were sold. The American trade book market recorded a 9.7% increase in revenue in July 2021. (Association of American Publishers) During the pandemic-induced global lockdowns, many people turned to books. Perhaps unsurprisingly, book sales generated $750.7 million in revenue in July 2021. Reading once again became a favorite pastime in many American households, who contributed to the 9.7% growth in this sector, compared to July of 2020. According to book sales statistics, eBook revenues in July 2021 went down 16% compared to the same period last year. Meanwhile, Paperbacks went up by 30%, generating $274.3 million in revenue. Video game sales amounted to $4.93 billion in July 2021, marking a 5% year-over-year increase. (Statista) Video games had a huge 2020 with more people than ever buying and playing games during the pandemic. Sales soared to $177.8 billion - an increase of 23.1% from 2019. The future looks equally promising, with some forecasts suggesting that the global gaming market will be worth $268.8 billion by 2025. Video game sales statistics for the US market in 2021 show that the industry is maintaining its upward trajectory. 2020 has seen a significant decline in draft beer sales, while canned beer sales went up. (NBWA) The forced closures of bars and restaurants during the pandemic had a significant impact on alcohol sales. Draft beer’s share of total volume declined from 10% in 2019 to around 6% in 2020. Beer sales statistics also show that demand for canned beer rose from 60% in 2019 to 67% in 2020. At the same time, sales of beer in glass bottles remained relatively unchanged, accounting for 29% of the market share in 2019 and 28% in 2020. Toilet paper sales in the US spiked by 845% in 2020. (Business Insider) Toilet paper hoarding in 2020 resulted in a spike in sales of 845% in March 2020, compared to 2019, with a total of $1.45 billion sold in a single month. In March 2020, 73% of all grocery stores ran out of toilet paper. By May, that figure dropped to 48%. Toilet paper sales statistics in 2020 exposed a somewhat disturbing and equally commercial side of consumer behavior in times of crisis. Girl Scout cookies sales amount to around $800 million during each cookie season. (Girl Scouts) Selling Girl Scout cookies has been a tradition in the US since 1912 and has become a lucrative business for many. Girl scouts sell about 200 million boxes of cookies each season and earn nearly $800 million in revenue. According to mouth-watering girl scout cookie sales statistics, the most popular variety is Thin Mints, followed by Samoas, Caramel deLites, and Tagalongs/Peanut Butter Patties. Sales: the Bottom Line In the choppy waters and hazy horizons of the pandemic-hit world, steering your business in the right direction isn’t easy. There are many challenges facing sales teams and managers, especially when it comes to locking down customers and promoting products and services. On the other hand, some industries are doing better than ever. Business sales statistics show that demand for canned beer, video games, and guns has never been higher. But that doesn’t change the fact that the future is uncertain for everyone, and the new business world is yet to shape out.
Victimless crimes without bloody traces, fingerprints, or mysteries worthy of Hercule Poirots’ insights and findings don’t shake the public too much. People don’t usually expect white-collar office workers with their noses buried into piles of papers to keep dark secrets. Despite that, white-collar crime statistics show the seriousness of this problem, which can have devastating consequences on businesses and enterprises. Money laundering, embezzlement, financial statement frauds, check or payment tampering are among the most common crimes committed by white-collar workers. We compiled data regarding those felonies to help you learn more about white-collar corporate crimes. White-Collar Crime Stats: Editor’s Choice Only 28% of white-collar employees involved in corporate crimes are women. A typical white-collar felon is a married male in his forties. White-collar crimes cost the United States over $300 billion per year. Only 6.1% of corporate criminals come from an unhealthy family background. Only 9% of frauds happen in nonprofit organizations. Corruption accounts for 43% of white-collar crimes and causes a median loss of $200,000 per case. The maximum prison sentence for insider trading in the US is 20 years. White-Collar Crime Demographics: Who Commits the Crimes? Only 28% of white-collar employees involved in corporate crimes are women. (2020 Global Study on Occupational Fraud and Abuse) If there has ever been a need to draw a forensic sketch of a typical corporate criminal for identification purposes, it very likely wouldn’t be a woman. Detailed research into the demographics of white-collar criminals showed that women are very rare corporate crime offenders, accounting for only 27% of committed frauds. The fact that a vast majority are men is understandable given the disproportion of females in higher management positions at corporations. Corporate crime statistics reveal that a typical white-collar felon is a married male in his forties. (Bajoka) (University of Cincinnati School of Criminal Justice) The typical white-collar criminal doesn’t look any different than the co-workers you sip your morning coffee with. He is likely in his mid-forties, though some start earlier. He doesn’t have a criminal record and hasn’t committed any criminal acts until his late 30s. Most of them boast at least a Bachelor’s degree and belong to the professions not so often associated with illegal activities: lawyers, financial advisors, accountants, and clergy members. Some companies use employee tracking software to get a better insight into their workforce, but these felons are usually in positions of power, where they don’t get tracked or at least know how to circumvent it. Statistics of white-collar crime in the US show 35.3% of felons have more than $10,000 in assets. (University of Cincinnati School of Criminal Justice) As we can see from the statistics gathered in the research commissioned by The University of Cincinnati School of Criminal Justice, over a third of white-collar criminals are well-established in the society, with more than $10,000 in assets. 63.5% have residential stability, and out of that number, 50.3% are homeowners. They are usually highly ranked in their companies, often at managerial positions, and 65.8% of them have steady employment. White-collar crime racial statistics reveal 73.9% of offenders are white. (University of Cincinnati School of Criminal Justice) Social and other prejudices often take over the minds of people when they think of criminal activities. Corporate crime is a different beast, though. Nearly three-quarters of white-collar offenders are white people coming from middle-class or better backgrounds. Notably, income tax frauds are overwhelmingly white-male driven crimes, with 91.4% of perpetrators being male and 89.1% white. Only 6.1% of corporate criminals come from an unhealthy family background. (University of Cincinnati School of Criminal Justice) When we speak or think about thefts, kidnapping, rape, or murders, we often envision the perpetrators coming from tough financial conditions and unhealthy family backgrounds. Statistics on white-collar crime indicate some often overlooked facts regarding the families the felons come from. Namely, only 6.1% of them were raised in families where they were abused, neglected, or abandoned as children. Only 6% grew up with at least one family member involved in criminal activities, and 15% had parents who struggled to provide the necessities of life. Common Types of White-Collar Crimes Asset misappropriation schemes account for 86% of frauds and cause a median loss of $100,000 per case. (2020 Global Study on Occupational Fraud and Abuse) Now that we know who commits white-collar crimes and the statistics behind them, we can determine the most common types of these crimes. According to the data gathered in the Report to the Nations global study on occupational fraud and abuse, the most frequent fraud scheme is asset misappropriation. This felony accounts for 86% of all white-collar crimes, but, luckily, it’s the least costly type with a median loss of $100,000 per case. Asset misappropriation happens when an employee misuses or steals the company’s resources and thus defrauds their employers. Financial statement frauds are the most costly type of white-collar crime, with a median loss of $954,000. (2020 Global Study on Occupational Fraud and Abuse) Luckily, white-collar crime statistics indicate that financial statement fraud schemes are the least common type of corporate fraud, accounting for only 10% of the cases. So what are financial statement frauds? They involve schemes in which the offender intentionally omits or misstatements the material in the company’s financial statements. Corruption accounts for 43% of cases and causes a median loss of $200,000 per case. (2020 Global Study on Occupational Fraud and Abuse) Corruption takes up an expectedly high proportion of occupational frauds. Offenses such as bribery, extortion, conflicts of interest, bid-rigging, and other illegal activities cause losses of around $200,000 per case. One of the more alarming facts about white-collar crime is that corruption cases often cost companies more than just money. Often their reputation goes on the line, and many have to reach out to costly reputation management services to mitigate the damage. 64% of organizational offenses in the United States happen in closely-held or private corporations. (United States Sentencing Committee) Speaking of the structure of the organizations where frauds are committed, 64% of them are private or closely-held corporations. US white-collar crime statistics show that limited liability companies account for 22.7% of cases, and 9.3% of cases happen in publicly traded corporations. If we dig deeper into the infrastructure of American businesses committing corporate offenses, we can conclude that most are small in size. Namely, 66.1% had fewer than 50 employees, and only 9.7% had more than 1,000. Only 9% of frauds happen in nonprofit organizations. (2020 Global Study on Occupational Fraud and Abuse) Although nonprofit organizations reported very low white-collar crime rates, the $75,000 in damages per case can be a serious blow to smaller organizations. According to the 2020 Report to the Nations study, private organizations accounted for 44% of corporate frauds, public ones for 26%, government agencies for 16%, and other company types for 6%. General White-Collar Crime Statistics FBI white-collar crime statistics show that these criminal offenses cost the US over $300 billion per year. (Cornell Law School 2020 Global Study on Occupational Fraud and Abuse) According to the Federal Bureau of Investigation (FBI), corporate crime offenses are estimated to cost the US more than $300 billion every year. Aside from fines, other penalties for white-collar crimes include paying the cost of prosecution, home detention, forfeitures, community confinement, supervised release, and even imprisonment. Only 56% of organizations conducted an investigation of their worst corporate criminal incident. (PwC's Global Economic Crime and Fraud Survey 2020) When we look at white-collar crime report statistics, we can see that the main reason for the persistent recurrence of corporate crime might be the lack of people willing to report it. Figures show that only 56% of businesses conducted an investigation of their worst incidents related to white-collar crime. Simultaneously, barely one-third of organizations reported the incident to the board. 89% of the interviewees reported negative emotions after an incident or fraud happened at the company. Taking all the necessary steps to address and better understand the issue results in fewer fraud cases in the future. Ignoring white-collar crime sentencing statistics for a moment, nearly 60% of companies who conducted detailed investigations into the fraud cases ended up being better off for it. 80% of white-collar crime perpetrators received some punishment in 2020, but only 59% of the cases were referred to law enforcement agents. (2020 Global Study on Occupational Fraud and Abuse) Organizations can refer to the corporate criminal incident internally, through civil litigation, or by reaching out to law enforcement. The statistics on the response to frauds indicate that nearly half of the victim organizations (46%) never refer these frauds to law enforcement, believing that internal discipline is sufficient. Another big reason for refraining from reaching out to the criminal justice system is the fear of bad publicity (32%). There were 755 cases of money laundering in the United States in 2020. (United States Sentencing Committee) White-collar crime statistics by the state indicate that the Southern District of Florida had the highest number of money laundering cases during the fiscal year of 2020 (42). This was followed by the Southern Districts of New York and Texas, with 33 convictions each. One of the ways to prevent money laundering and tax evasion is to engage professional tax software solutions to help companies stay up-to-date and compliant with state and federal tax laws. White-collar crime prison statistics reveal that the maximum prison sentence for insider trading in the United States is 20 years. (US Securities and Exchange Commission) Even though not many people and organizations are willing to go to law enforcement in resolving corporate fraud cases, there are exceptions. When reaching out to the criminal justice system to solve the problem, victim organizations can expect the maximum prison sentence for insider trading to be 20 years. At the same time, the maximum amount of money charged from corporate criminals is $5 million for individuals and $25 million for organizations. Obviously, insider trading is just one of the many corporate frauds that can ruin a company’s finances and reputation, but the steep punishments should serve to encourage more people to speak up and get the felons convicted.
Diversity and inclusion are some of the most important policies that can not only improve the working environment and enhance employee engagement but significantly contribute to all other aspects of any business. The benefits are numerous, and we will discuss them as we unveil some of the most interesting diversity in the workplace statistics. Being a diverse company means hiring people of different ethnicities, gender, age, religion, etc. Companies that have successfully implemented D&I initiatives are often seen as more desirable for employees due to their broader perspective and the positive attitude they cherish. We have done our research, and these are some of the reasons everyone should embrace diversity. Editor’s Choice of Diversity in the Workplace Statistics In 2019, millennials accounted for 35% of the US labor force. Only 8% of CEOs at Fortune 500 companies are female. Diverse companies are 70% more likely to acquire new markets. 46% of Hispanic and 39% of black women earn less than $15 an hour. During the COVID-19 pandemic, fathers who worked remotely were promoted three times more than women in the same position. General Workplace Diversity Data and Stats In 2020, only 17.9% of persons with disabilities were employed in the US. (US Bureau of Labor Statistics) Based on the report published by the US Bureau of Labor Statistics, in 2020, the unemployment rate for persons with disabilities grew compared to the previous year. In 2019, the percentage of employed persons with disabilities in the US was 19.3. However, those numbers dropped to 17.9 the following year. Regarding people without disabilities, the report stated 66.3% of them were employed during 2019, but the numbers decreased to 61.8% in 2020. These rates show that there is still much work to be done to overcome the lack of diversity in the workplace, and statistics will need to include more people with disabilities in the workforce going forward. By 2024, it’s expected that 24.8% of the US workforce will be employees older than 55. (Deloitte) It’s not a secret that the US workforce is aging each year. Research on shifting workforce demographics, conducted by Deloitte, suggests that by 2024 employees aged 55+ will make up 24.8% of the workforce. This might not mean much to you, but it is a severe increase if we go back to 1994 when this percentage was significantly lower, or to be precise, 11.9%. The research also projects that the US workforce diversity statistics are about to change and, by 2024, less than two-thirds of the labor force will be defined as “white non-Hispanic.” Back in 1994, over 75% of the labor force fell into that category. In 2019, millennials accounted for 35% of the US labor force. (Pew Research Center) Millennials are all those born between 1981 and 1996, and back in 2019, they accounted for over a third of the US labor force. In 2016, the millennial generation surpassed Generation Xers and became the largest population in the US labor force. According to research from 2019, Millennials are expected to comprise 75% of the global workforce by 2025. Gender Diversity in the Workplace Statistics Only 8% of CEOs at Fortune 500 companies are female. (Statista) The gap between male and female leadership roles has always been a thing, and there are multiple statistics to confirm that. However, it looks like things are changing for the better. As Statista confirmed earlier this year, there’s been a new record when it comes to female CEOs. As of June 14, 2021, there were 41 female CEOs employed at Fortune 500 companies. According to the statistics, this wasn’t the only record that got broken. For the first time ever, two black women are running America's 500 highest-grossing companies, giving us hope that gender diversity on executive boards might become a reality in the not-so-distant future. In terms of the median salary in the US, women earn around 18% less than men. (PayScale) The gap between the leadership roles isn’t the only hurdle that women are facing in business nowadays. PayScale, a company that helps employers and employees understand the appropriate pay for every position, reviewed these issues in its Gender Pay Gap Report for 2021. According to this report, women earn only $0.82 for every dollar a man makes. Although it might sound discouraging, this is a slight improvement compared to 2020, when they earned one cent less, as per employment diversity statistics. Also, bear in mind these are uncontrolled pay gap statistics - when doing the same job with the same qualifications, the numbers are less dire: women earn 98 cents for every dollar a man does. During the COVID-19 pandemic, fathers who worked remotely were promoted three times more than women in the same position. (CNBC) The ongoing COVID-19 pandemic has affected all aspects of the business as we know it. Many had to adapt to the new reality and switch to their home offices instead. According to a CNBC report, 34% of men with children working from home received some kind of promotion during this period. On the other hand, women’s jobs have been hit much harder by the pandemic. According to an analysis conducted by the National Women’s Law Center, of the 1.1 million workers ages 20 and over, who left the labor force between August and September of 2020, 865,000 were women. Racial and Cultural Diversity in the Workplace Statistics 46% of Hispanic and 39% of black women earn less than $15 an hour. (The Washington Post) In 2019, around 39 million people earned less than $15 per hour. These 39 million employees made about 28% of the workforce at the time, and the majority of the low-wage category consisted of Hispanic and black women. In fact, they were more than 2x as likely as white men to fall into this wage category. Based on the Washington Post’s research on diversity in the workplace, statistics haven’t really changed since 2019. Roughly 46% of Hispanic women and 39% of Black women still make less than $15 an hour. On the other hand, only 18% of White and Asian men hover around this wage bracket. More than 90% of all Google employees are white or Asian men. (Statista) According to Statista, the distribution of Google employees in the US from 2014 to 2021 does not look very racially or gender-diverse. The data for 2021 shows that white men account for 50.4% of employees, with Asian men following with 42.3%. On the flip side, only 4.4% of the employees are black men and women. If you look at the timeline of these statistics on diversity in the workplace, you will see the Asian population is experiencing steady growth, while the white population dropped from 64.5% in 2014 to 50.4% in 2021. In 2019, black people held only 3.2% of senior leadership roles in large organizations in the US. (Coqual) “Being Black in Corporate America” is the name of Coqual’s intersectional exploration aimed to show if and how things have changed for the black people in the US during the past few years. The research on the representation of black adults in the US has shown that only 3.2% of black people held senior leadership roles in major companies, with just 0.8% of them being Fortune 500 CEOs. Benefits of Diversity in the Workplace Statistics Diverse companies produce 19% more revenue than those with non-diverse leadership. (Forbes) A study by the Boston Consulting Group (BCG), published in 2018, has found that diverse leadership increases the bottom line for companies. According to the study, increasing the diversity of leadership teams can lead to improved financial performance and better innovation. The study included 1,700 companies of all sizes across eight different countries. These findings are important as they show that diversity isn’t just an inclusion metric but an integral part of any successful business. In 2019, gender-diverse companies were 25% more likely to outperform their competitors. (McKinsey) Various diversity in the workplace stats show just how important diversity is and how it can help boost the overall performance of businesses of all sizes. Based on the findings from McKinsey’s research in 2019, companies with gender diversity have 25% higher chances to achieve higher profits than those with less gender diversity on the executive boards. Ethnic diversity in leadership teams is another vital factor. According to the report, companies implementing ethnic and cultural diversity on the executive level have a 36% likelihood of outperforming the competition. Diverse companies are 70% more likely to acquire new markets. (Harvard Business Review) (Josh Bersin) Establishing a diverse workplace is vital for all modern organizations, and there are many diversity in the workplace statistics that prove this. Diverse companies also have 2.3 times higher cash flow per employee. They are also far better at capturing new markets when compared to the companies that do not practice diversity hiring. 80% of US job candidates look for inclusion when choosing an employer. (Deloitte) Salary and working hours aren't the only deciding factor when it comes to choosing a new employer. Back in 2017, Deloitte published a research paper that surveyed more than 1,300 full-time employees from a range of organizations all across the US. The paper showed just how important diversity and inclusion initiatives are by showing that four-fifths of all employees look for an inclusive workplace. 39% of respondents confirmed they would quit their current job if they found a more inclusive working environment, while 23% indicated they already left a job for that very reason.
Women account for 50.8% of the US population, hold 57% of all undergraduate degrees, and approximately 60% of all master’s degrees. And even though they hold about 52% of all management-level jobs, American women cannot keep pace with men in terms of representation when it comes to top leadership roles. As male vs. female CEO statistics show, it’s the profit and loss roles or P&L responsibilities such as leading a brand, unit, or division, that set executives on the track to becoming a CEO. On the other hand, women who advance into C-suites - the “chief” jobs in companies - typically take on the roles such as head of human resources, legal, or administration. Although all of these functions are extremely important, the line of work they focus on doesn’t involve profit-generating responsibilities, which rarely makes them a path to running a company. Why does the percentage of CEOs that are female remain low in all parts of the world? There isn’t a simple answer to this question. Several studies have shown that it’s the fusion of work-life constraints, early professional trade-offs, and firmly established attitudes towards women in power and the skills and traits that make a good leader that can explain why the careers of equally ambitious and capable men and women often take such different turns. Let’s take a look at some of the most interesting findings. Male vs Female CEO Statistics - Editor’s Choice Female CEOs are running 41 Fortune 500 companies. There are two Black women among the Fortune 500 CEOs. Women made up only 5% of the CEOs appointed in 2020 globally. At the CEO level, men outnumber women by approximately 17 to one. 59% of male employees aspire to become CEOs versus 40% of women. 77% of women say the biggest obstacle to gender equity at the workplace is the lack of information on how to advance. Between 2015 and 2020, the share of women in senior vice president roles in the US increased from 23% to 28%. (McKinsey & Company) Over the same period, the percentage of women in the C-suite went up from 17% to 21%. All women, especially those of color, remained significantly outnumbered in senior management positions. However, prior to the start of the coronavirus pandemic, the representation of female workers in corporate America was slowly trending in the right direction. According to 2020 statistics on female CEOs in the United States, 21% of C-suite members were women. (McKinsey & Company) Based on the survey results published by McKinsey & Company, there’s a leaky pipeline for women in leadership. In 2020, female workers accounted for 47% of entry-level positions, 38% of management roles, and 33% senior management/director roles. Women were entrusted with under one third (29%) of all vice president positions in American organizations. For every 100 men who got promoted to a managerial role, only 85 women advanced to the same position, based on the 2020 data. (McKinsey & Company) This gap was even larger for women of color as only 71 Latinas, and 58 Black women received a promotion. Consequently, women remained underrepresented at the managerial level holding just 38% of manager positions, while men accounted for 62%. Male vs female CEO statistics from 2020 indicate that 39% of senior-level women burned out compared to 29% of men. (McKinsey & Company) Furthermore, 36% of women felt pressured to work more, in comparison with 27% of men. At the same time, 54% of C-suite women reported that they constantly felt exhausted, and so did 41% of men in similar positions. More than 50% of women in senior leadership roles promote gender and racial equality at work, in comparison with approximately 40% of male top executives. (McKinsey & Company) Women in leadership positions are more likely than men in senior-level roles to take a public stand on racial and gender diversity and champion the advancement of employee-friendly programs and policies. Women CEOs are also more likely to sponsor and mentor other female workers. According to the results of a recent survey, 38% of women in senior-level positions currently mentor or sponsor at least one woman of color, compared to only 23% of men in the same roles. Female CEOs are running 41 Fortune 500 companies. (Fortune, Statista) In 2021, the number of women appointed to CEO positions in America's 500 highest-grossing companies reached an all-time high. However, the new record still only translates to approximately 8% of female representation at the top of the country's largest public businesses. On the plus side, the number of women CEOs of Fortune 500 companies almost doubled in comparison with 2018 when there were 24 females leading the nation’s biggest businesses. Calls for diversity and inclusion in the highest echelons of America’s business world are starting to bear fruit as the number of female Fortune 500 chief executive officers increased for the third consecutive year. The top five biggest female-led Fortune 500 businesses as of August 2021 are CVS Health (rank four), Walgreens Boots Alliance (rank 16), General Motors (rank 22), Anthem (rank 23), and Citigroup (rank 33). Speaking of women in leadership roles, statistics show that there are two Black women among the Fortune 500 CEOs. (Fortune) For the first time, two Black women are running Fortune 500 businesses - Roz Brewer of Walgreens Boots Alliance (rank 16) and Thasunda Brown Duckett of TIAA (rank 79). Before Duckett and Brewer started their new jobs in 2021, only one Black woman - Ursula Burns, former Xerox chief - had ever been appointed CEO at a Fortune 500 business on a permanent basis. After Burnes stepped down from the role in 2017, and, with the exception of Bed Bath & Beyond's Mary Winston, who worked as interim chief for a few months in 2019, Black female chief executive officers have been missing from the Fortune 500 list ever since. Citigroup CEO Jane Fraser is the first woman to run a major Wall Street bank. (Fortune) Fraser’s appointment marked huge progress for the financial industry. Much like Dick's Sporting Goods chief Lauren Hobart, Clorox chief Linda Rendle, new Coty CEO Sue Nabi, Walgreens Boots Alliance’s Roz Brewer, Thasunda Brown Duckett of TIAA, and CVS’s CEO Karen Lynch, Fraser took over from a male CEO. Statistics on Fortune 500 CEOs by gender reveal that there were only 37 female and 463 male chiefs leading America’s highest earning businesses in 2000. (Fortune) The number of women in CEO positions in the Fortune 500 hasn’t been growing steadily throughout the last two decades. There were 24 female chiefs in 2015, 21 women CEOs in 2016, and 32 women running Fortune 500 businesses in 2017, while that number dropped to 24 in 2018. At the median, 16 female CEOs earned $13.6 million in 2020, in comparison to $12.6 million for the 326 men included in a study. (Equilar) According to a study published in May 2021 comparing a male CEO salary vs. a female CEO salary, women have outpaced men in total pay but remained underrepresented in executive positions. Equilar’s study indicates that Lisa Su, the chief executive officer of Advanced Micro Devices, was the highest-paid woman for the second consecutive year and the highest-paid CEO overall in 2020. Globally, women made up only 5% of the CEOs appointed in 2020. (Heidrick & Struggles) The highest percentage of newly-appointed female CEOs was in Ireland (15%), while the lowest was in Brazil (0%). This is according to a paper that analyzed the backgrounds of chief executives leading 965 of the largest companies in 20 markets around the world. It sought to identify the skills and experience that shaped their path to the top while taking different male vs. female CEO statistics into account. At the CEO level, men outnumber women by approximately 17 to one. (Morningstar) According to a study that explored the gender gap in US companies, the number of male executive officers is seven times higher than the number of women holding the same positions. More than 50% of the companies analyzed didn’t have a single female on their lists of executive officers. Jackie Cook, the author of the Morningstar report, found that online retail giant Amazon didn’t have any women among its highest-paid executives as of 2020. Women who negotiate for raises and promotions are 30% more likely to be considered as "too aggressive" or "intimidating". (Business Insider) Speaking of male managers vs. female managers, statistics reveal that women who don’t negotiate at all are 67% less likely to receive the same negative feedback. The proportion of women in senior management roles increased from 20% in 2011 to 29% in 2020, globally. (Grant Thornton) As 2019 saw a jump of 5% compared to 2018 (amounting to a total of 29%), 2020 represents a leveling off of the progress made during the previous year. This lack of movement doesn’t necessarily reflect a failure of companies to address the existing gender gap. Globally, the proportion of companies with at least one woman in senior management was 87% in 2020. (Grant Thornton) The number of female CEOs and senior managers has risen by almost 20 percentage points over the last few years. For comparison, this figure stood at 68% in 2015 and 68% in 2017. 77% of women say the biggest obstacle to gender equity in the workplace is the lack of information on how to advance. (Working Mother Research Institute) Only 41% of female survey participants, as opposed to 64% of male respondents, said they have a network of coaches, mentors, and sponsors offering them career guidance. 37% of women versus 64% of men said that their companies provide information on career paths that lead to executive roles. (Working Mother Research Institute) Additionally, women CEO statistics indicate that 74% of female employees understand what the specific requirements are for advancing to the highest-paying roles in their companies even though they don’t receive this type of information directly. 60% of women believe they have the same opportunities to advance as anyone else at their workplace versus 74% of men. (Working Mother Research Institute) Similarly, 65% of women express they are satisfied with the way their careers are progressing, and so do 78% of men. Male vs female CEO stats reveal that 59% of male employees aspire to become chief executives versus 40% of women. (Working Mother Research Institute) Of those women who aspire to become CEOs, 6% are first-level managers (as opposed to 13% of men) and 39% are executives. The same goes for 40% of men hoping to take on the role of chief executive officer. Businesses with high representations of women in leadership roles had a 35% higher return on equity and 34% higher total shareholder return in comparison with male-dominated companies. (Catalyst) Female vs male CEO statistics compiled by an NGO during a review of 353 Fortune 500 companies show that the differences were most apparent in facial services, consumer discretionary, and consumer staples industries.